frame
Howdy, Stranger!
It looks like you're new here. If you want to get involved, click one of these buttons!
Sign In RegisterHowdy, Stranger!
It looks like you're new here. If you want to get involved, click one of these buttons!
Quick Links
Categories
- 496 All Categories
- 312 General
- 144 General Discussions
- 67 Feature Request/Bug Report
- 56 Sales Questions and Answers
- 16 Time4VPS Life
- 14 Help requests
- 16 Server management
- 220 Tutorials
- 51 Various Tutorials
- 40 Web hosting control panels
- 40 Performance and Security
- 25 Web Applications
- 44 Linux Applications
- 20 Windows VPS
[How Do I Find Out?] How Much of my Memory Is In Use?
 Lawrence
Member
Introduction
It is often important to check memory usage and memory used per process on servers so that resources do not fall short and users are able to access the server. For example a website. If you are running a webserver, then the server must have enough memory to serve the visitors to the site. If not, the site would become very slow or even go down when there is a traffic spike, simply because the memory would fall short.
vmstat and free commands in Linux based operating systems are powerful tools for viewing memory allocation. They are tools that server administrators should understand well, but (like many Linux tools) can be confusing. This article explains output and some typical ways you might want to use them.
For this tutorial we are using Ubuntu 16.04 distribution, however, you should be able to use it for all Debian and Ubuntu distributions we offer on Time4VPS.
Update System
First things first. Like always, first of all, we recommend updating your server. It can be done by simply executing:

The free command is the most simple and easy to use to check memory usage on Linux. When used without options, the output looks like this:

Some simple facts about this output include:
- All numbers are in Kilobytes (KB) (i.e. 1024 bytes) by default, but this can be customized (see below).
- The shared column is obsolete. (This is noted on the free man page).
- The output shows memory sizes and allocation for RAM and swap memory, but it also explains how much of that physical RAM is allocated for buffering and caching when it is being used by an application.
free has a couple of useful options if you would like to view the output in other units:
-b - Displays output in Bytes
-k - Displays output in Kilobytes
-m - Displays output in Megabytes
-g - Displays output in Gigabytes
--tera - Displays output in Terabytes
-h - Displays output in a human-readable format (e.g. 1.5M)
-t - Add s a total row to the output
To display in a more readable format, we can pass the "-m" option to display the output in megabytes:

The m option displays all data in MB. The total of 16384 MB is the total amount of RAM installed on the system, which is 16 GB. The used column shows the amount of RAM that has been used by Linux, in this case, 124 MB. The output is pretty self-explanatory. Linux has the habit of catching lots of things for faster performance, so that memory can be freed and used if needed.
The last line is the swap memory, which in this case is lying entirely free.

vmstat (virtual memory statistics) is a computer system monitoring tool that collects and displays summary information about operating system memory, processes, interrupts, paging and block I/O. Users of vmstat can specify a sampling interval that permits observing system activity in near-realtime.
We will use the command to get another view into memory usage:

We can see this in megabytes by choosing our unit with the "-S" flag:

As you can see, this tool helps us break down the "-/+ buffers/cache" category of the "free" command.
We get to see how much of that block is used for buffering and how much for the cache.
To get some general statistics about memory usage, type:

It is often important to check memory usage and memory used per process on servers so that resources do not fall short and users are able to access the server. For example a website. If you are running a webserver, then the server must have enough memory to serve the visitors to the site. If not, the site would become very slow or even go down when there is a traffic spike, simply because the memory would fall short.
vmstat and free commands in Linux based operating systems are powerful tools for viewing memory allocation. They are tools that server administrators should understand well, but (like many Linux tools) can be confusing. This article explains output and some typical ways you might want to use them.
For this tutorial we are using Ubuntu 16.04 distribution, however, you should be able to use it for all Debian and Ubuntu distributions we offer on Time4VPS.
Update System
First things first. Like always, first of all, we recommend updating your server. It can be done by simply executing:
apt-get update
The free command is the most simple and easy to use to check memory usage on Linux. When used without options, the output looks like this:
free
Some simple facts about this output include:
- All numbers are in Kilobytes (KB) (i.e. 1024 bytes) by default, but this can be customized (see below).
- The shared column is obsolete. (This is noted on the free man page).
- The output shows memory sizes and allocation for RAM and swap memory, but it also explains how much of that physical RAM is allocated for buffering and caching when it is being used by an application.
free has a couple of useful options if you would like to view the output in other units:
-b - Displays output in Bytes
-k - Displays output in Kilobytes
-m - Displays output in Megabytes
-g - Displays output in Gigabytes
--tera - Displays output in Terabytes
-h - Displays output in a human-readable format (e.g. 1.5M)
-t - Add s a total row to the output
To display in a more readable format, we can pass the "-m" option to display the output in megabytes:

The m option displays all data in MB. The total of 16384 MB is the total amount of RAM installed on the system, which is 16 GB. The used column shows the amount of RAM that has been used by Linux, in this case, 124 MB. The output is pretty self-explanatory. Linux has the habit of catching lots of things for faster performance, so that memory can be freed and used if needed.
The last line is the swap memory, which in this case is lying entirely free.

vmstat (virtual memory statistics) is a computer system monitoring tool that collects and displays summary information about operating system memory, processes, interrupts, paging and block I/O. Users of vmstat can specify a sampling interval that permits observing system activity in near-realtime.
We will use the command to get another view into memory usage:
vmstat
We can see this in megabytes by choosing our unit with the "-S" flag:
vmstat -S M
As you can see, this tool helps us break down the "-/+ buffers/cache" category of the "free" command.
We get to see how much of that block is used for buffering and how much for the cache.
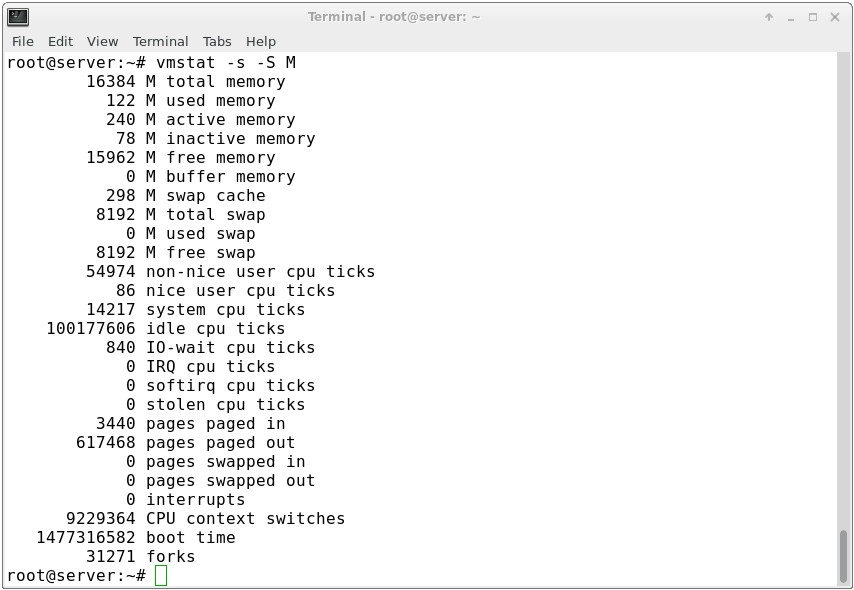
To get some general statistics about memory usage, type:
vmstat -s -S M


